ConfigBytes: Nexus 6000/5600 Latency & Buffer Monitor
#CONFIGBYTES
Episode 2
Platforms: Nexus 6000 & 5600 (UPC based ASIC)
Latency Monitor:
The switch latency monitoring feature marks each ingress and egress packet with a timestamp value. To calculate the latency for each packet in the system the switch compares the ingress with the egress timestamp. The feature allows you to display historical latency averages between all pairs of ports, as well as real-time latency data.
You can use the latency measurements to identify which flows are impacted by latency issues. In addition the statistics generated by the switch latency monitoring feature allow you to plan network topologies, manage incident responses and identify root causes for application issues in the network. You can also use the statistics to provide a Service Level Agreement (SLA) for latency intensive applications.
Configuration Example for Switch Latency Monitoring
Requires 7.x code
This example shows how to configure switch latency monitoring:
switch(config)# hardware profile latency monitor base 800
switch(config)# interface ethernet 1/1
switch(config-if)# packet latency interface ethernet 1/2 mode linear step 40
switch(config-if)# packet latency interface ethernet 1/3-4 mode exponential step 40
switch(config-if)# packet latency interface ethernet 1/5 mode custom low 40 high 1200
switch(config)# interface ethernet 2/1
switch(config-if)# packet latency interface ethernet 1/1 mode exponential step 80
Buffer Utilization Histogram:
The Buffer Utilization Histogram feature enables you to analyze the maximum queue depths and buffer utilization in the system in real time. Instantaneous or real time buffer utilization information is supported by the hardware. You can use software to obtain the history of the buffer usage by polling the hardware at regular intervals. Obtaining an historic timeline of the buffer usage provides a better picture of the traffic pattern in the system and helps in traffic engineering. Ultimately, you are able to make better use of the hardware buffer resources.
On the Cisco Nexus device, every three ports of 40 Gigabit Ethernet or every 12 ports of 10 Gigabit Ethernet have access to a shared 25 Mb packet buffer. 15.6 Mb are reserved for ingress and 8.6 Mb are reserved for egress. The remaining space is used for SPAN and control packets.
The Buffer Utilization Histogram enables you to do the following:
- Configure buffer utilization history measurements on the interested ports.
- View buffer utilization over an interval of time.
- Configure either a slow or a fast polling mode.
- Copy collected statistics to the buffer_util_stats file on the bootflash drive every hour to allow for later analysis. The collected statistics are appended to the end of the file after an hour and a timestamp is placed in the header that has the interface name.
Configuration Example for Buffer Utilization:
Requires 7.x code
switch# configure terminal
switch(config)# interface ethernet 1/1
switch(config-if)# hardware profile buffer monitor
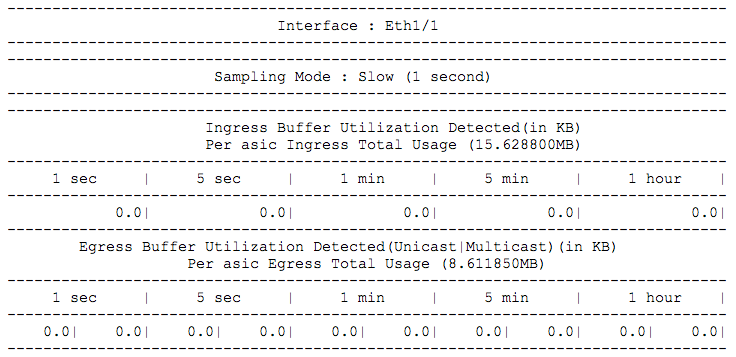
Output Examples for Buffer Utilization Histogram
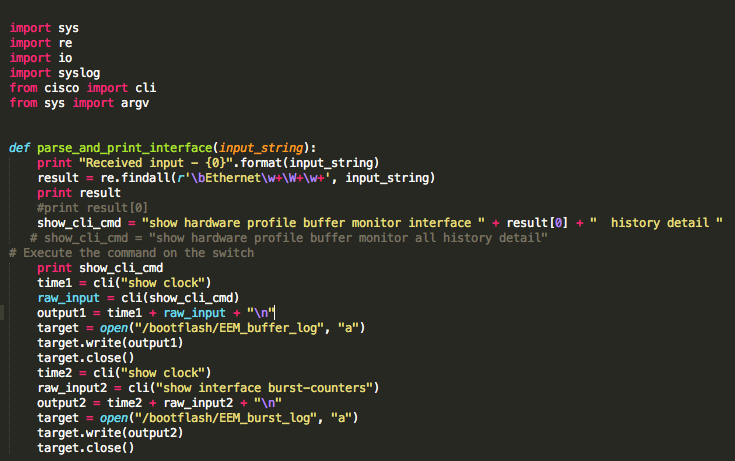
Write Histogram Data to File & Syslog Alert via EEM/Python
Python Script:
import sys
import re
import io
import syslog
from cisco import cli
from sys import argv
def parse_and_print_interface(input_string):
print “Received input – {0}”.format(input_string)
result = re.findall(r’\bEthernet\w+\W+\w+’, input_string)
print result
#print result[0]
show_cli_cmd = “show hardware profile buffer monitor interface ” + result[0] + ” history detail “
# show_cli_cmd = “show hardware profile buffer monitor all history detail”
# Execute the command on the switch
print show_cli_cmd
time1 = cli(“show clock”)
raw_input = cli(show_cli_cmd)
output1 = time1 + raw_input + “\n”
target = open(“/bootflash/EEM_buffer_log”, “a”)
target.write(output1)
target.close()
time2 = cli(“show clock”)
raw_input2 = cli(“show interface burst-counters”)
output2 = time2 + raw_input2 + “\n”
target = open(“/bootflash/EEM_burst_log”, “a”)
target.write(output2)
target.close()
def main():
print sys.argv
parse_and_print_interface(sys.argv[2])
if __name__==”__main__”:
sys.exit(main())
EEM Script:
event manager applet burst_monitor
event syslog pattern “bigsurusd”
action 1 cli source nameofbufferscript.py -l “$_syslog_msg”
